Posts

Showing posts from February, 2024

Vector Analysis

Image
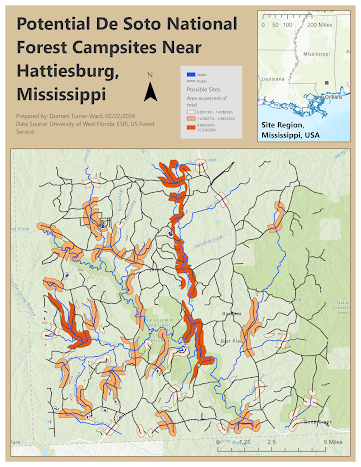
  This map, made in ArcGIS, illustrates possible campsite locations in the De Soto National Forest near Hattiesburg, Mississippi. These areas are identified as being within three hundred meters of a road and within one hundred fifty meters of a lake or five hundred meters of a rivers. The regions are also color-coded into three area classes, with the darkest orange representing the areas which comprise the greatest percentage of the whole. Throughout this project, I learned how to conduct vector analysis and used a variety of geoprocessing tools to conduct complex selections based on feature attributes and distances. I created the above map using a fixed distance buffer and a variable distance buffer and performed a union of the resulting shapes, then erased designated conservation areas from the selection area.  I also analyzed a group of datasets related to Escambia County public services and superact risk features, conducting actions including using select by location to find featur

Projections

Image
 In this exercise, I explored the results of using various projections in ArcGIS Pro and compared the resulting calculated areas of several Florida counties. First, I acquired the data needed for this project; one file was available through the GIS student repository, while the other was downloaded from FGDL.org. Then, I had my first introduction to the ArcGIS Pro Geoprocessing Tools. I used the Project Tool to create two new maps by changing the projection systems. The original map utilizes Albers, while the newly created maps utilize UTM 16 and Florida State Plane North. Then, I utilized attributes table to compare the projections quantitatively. To do this, I first used the Geoprocessing tool Calculate Geometry Attributes to create a calculation for polygonal area of each county in square miles. Once this was done, I opened the attributes tables of each projection and created new layers to isolate the counties of Polk, Miami-Dade, Escambia, and Alachua. Interestingly, each projectio

ArcGIS Field Map Mobile and Sharing Maps

Image
In this project, I explored data collection and communication using ArcGIS Pro and Field Map Mobile, then practiced sharing the resulting map in multiple formats. First, I used ArcGIS Pro to create a map with appropriate domains: Excellent, Fair, and Poor. Then, I created a new empty Feature Class, with fields for Condition, Notes, and a photo, leaving the projection as Web Mercator. I edited the symbology so that Excellent condition is represented by a green dot, Fair condition by an orange dot, and Poor condition by a red dot. Then, I connected to the UWF Organization to share the feature class as a web layer. From there, I created a web map from ArcGIS Online so that I could add data from Field Maps. Then, I downloaded Field Maps to my phone and collected data from an area of the UWF campus! I chose to highlight and investigate the state of sidewalks on the university campus. This is a very important issue, as sidewalks in poor condition are especially dangerous for students with di